
















Until recently, investment news was consumed by the opportunities and risks of artificial intelligence, cryptocurrency, and the “picks and shovels” companies that support them. That is still a genuinely hot topic, and it deserves to be.
All the while, the bond market has kept marching along, mostly unnoticed. It is not glamorous. But it is every bit as foundational as any single industry story, and it sits on top of a far larger and deeper market. Every mortgage, every business loan, every retirement account and every bank balance sheet in the country is priced off of it, whether anyone is paying attention or not.
Now, suddenly, rates and yields are back in the headlines.
That matters well beyond Wall Street. Whether you carry a mortgage, keep a rainy day fund in savings, hold a certificate of deposit, or watch a retirement account creep toward a number you can live on, the level of interest rates quietly sets the terms for nearly every financial decision you make. This piece is our attempt to lay out where rates stand today, how we got here, and what it might mean for you as both a borrower and a saver.
As of this writing, at the end of September 2026, the 10-year U.S. Treasury note yields close to 5.30%, and the Federal Reserve’s target range for short-term rates stands at 3.75% to 4.00%.
A Contest Over the Fed
Newly installed Federal Reserve Chair Kevin Warsh, who took over from Jerome Powell in late May, finds himself caught between a rock and a hard place. The rock is a White House that wants borrowing costs lower, no matter the inflation backdrop. The hard place is the bond market itself, which does not care about politics and sets prices based on the judgment of millions of participants around the world.
That tension has become public and at times colorful. There seems to be a standoff between Treasury Secretary Scott Bessent, who wants to keep the government’s own borrowing costs down, and Warsh, who is trying to lower inflation and protect the value of the dollar. Bessent has claimed a striking degree of control over markets and currencies; we are openly skeptical that anyone can fully manage a market with that many independent participants. As the investor Stanley Druckenmiller has observed, governments that try to hold prices against economic fundamentals tend to lose that fight eventually. The only real question is how much they spend before they concede.
Why Rates Matter to Us
We are bankers, so rates matter to us more than most. A bank effectively “rents” money from depositors, then lends those deposits back out at a higher rate to earn a spread. That spread pays for people, technology and everything else that keeps a bank running. At the end of the day, that spread is how a bank makes money, which is exactly why the level and shape of interest rates shows up in nearly everything we do, from what we pay on a savings account to what we charge on a loan.
Banks do not all move at the same speed, either. Loan rates, especially longer-term loans like mortgages, tend to track the bond market fairly closely and often move first. Deposit rates usually follow, sometimes with a lag, as banks weigh how much of that higher rate environment they need to pass along to attract and keep savers. That lag is worth knowing about if you’re wondering why your savings account or CD offer has not moved in lockstep with headlines about Treasury yields or moves by the Federal Reserve.
The Modern History of Yield
That heading probably sounds like the title of a paper you dreaded reading in a college economics class. Bear with us.
After reaching a high of 15.84% in August 1981, the bellwether 10-year U.S. Treasury note spent more than four decades on a mostly downward path, through booms and busts alike. Falling inflation, an aging population that saved more than it spent, a more globalized economy where exporting countries purchased U.S. Treasurys, and a few decades of increasingly aggressive central bank intervention all pushed in the same direction. There were plenty of frightening detours along the way, and as a former bond trader, I can tell you those detours felt a lot longer while we were living through them than they look on a chart today. Still, tracing the line from 1981 through February 2020, the pattern is unmistakable: 40 years of decline.
The modern low, 0.54%, was hit in March 2020, just as COVID-19 brought economic activity to a screeching halt. One has to wonder why the Treasury didn’t lock in 30-year financing at those levels while it could. Instead, the federal deficit that year set an unchallenged record at a little over $3 trillion.

The question today is whether that decades-long trend line has changed.
A quick look at yields since 2020 tells a different story. The 10-year note stands close to 5.30% today — not an all-time high, but it’s a level unseen in more than 15 years. A year ago, that same yield sat around 4.00%. That is a meaningful move, and in effect, it’s a vote cast by the global investing community.
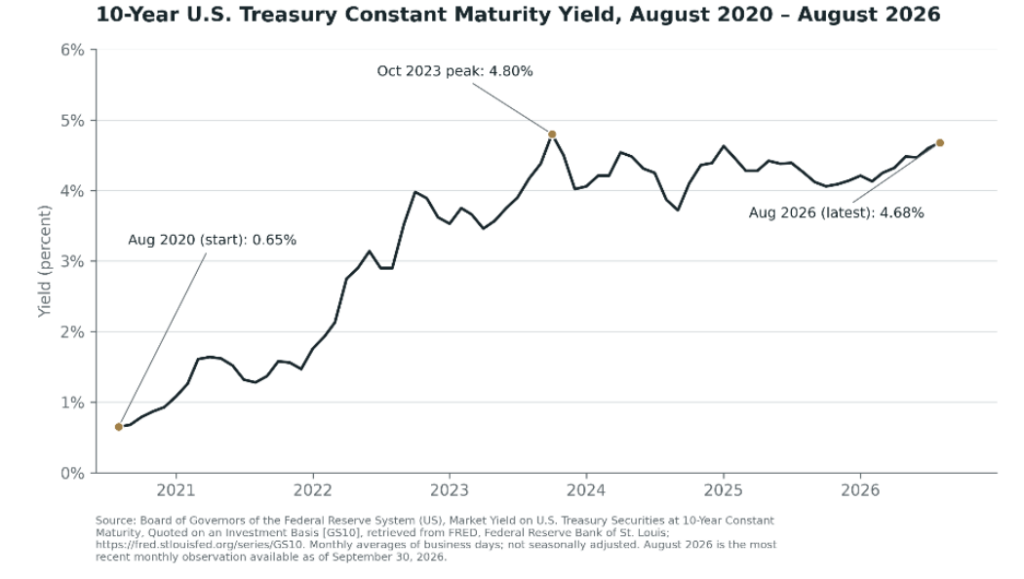
Has the long downtrend actually turned upward? Financial writer Bill Bonner has argued as much more than once in recent weeks, pointing to Japan’s benchmark government bond yield touching 3% for the first time since 1996 as part of a broader, worldwide bond sell-off. His shorthand for the American version of the same problem is that the country’s debt has grown so large that interest costs are starting to rival what the federal government spends on defense.
It kind of feels that way, does it not?
A Sidebar on the Standing of the U.S. in the Global Marketplace
Here’s a shift that has not received nearly enough attention: the changing position of the United States within the global bond market.
In graduate school, and for most of my years trading bonds, U.S. Treasury yields were treated as the benchmark “risk-free” rate, the floor against which every other country’s borrowing costs were measured. Bond traders weigh many factors when pricing debt, including inflation expectations, the likely path of a currency, the pace of economic growth, and government fiscal and monetary policy, among others. For most of the postwar era, the U.S. sat at the safe end of nearly every comparison.
Back in 1990, 10-year yields for a sample of OECD countries looked like this. Notice that nearly every country paid more than the U.S. to borrow.
| Country | 10-Year Yield, 1990 |
|---|---|
| USA | 8.6% |
| Japan | 7.4% |
| West Germany | 8.9% |
| United Kingdom | 11.1% |
| France | 9.9% |
| Italy | 11.5% |
| Canada | 10.8% |
| Spain | 14.7% |
| Sweden | 13.0% |
| Australia | 13.0% |
Here are yields for the same countries today, as of September 2026, based on data from World Government Bonds.
| Country | 10-Year Yield, Sept. 2026 |
|---|---|
| USA | 4.96% |
| Japan | 3.00% |
| Germany | 3.51% |
| United Kingdom | 5.36% |
| France | 4.47% |
| Italy | 4.42% |
| Canada | 3.94% |
| Spain | 3.98% |
| Sweden | 3.24% |
| Australia | 5.34% |
This table tells a rather different story. The UK and Australia still trade close to U.S. levels, much as they did in 1990. But nearly everyone else, including Spain and Italy, once considered far riskier borrowers, now borrows more cheaply than the U.S. does.
That is a real shift in how the world prices American credit. Large deficits, a growing mountain of outstanding debt, and a more combative approach to global relations all appear to be pushing U.S. borrowing costs higher relative to the rest of the developed world. Close to 4 out of every 10 tax dollars collected already goes toward interest on debt that has already been spent before a single new program gets funded. Zoom out further and the picture gets bigger still. Total global government and corporate borrowing is on pace to reach roughly $29 trillion this year alone, according to OECD data, double the pace of a decade ago, and total world debt is estimated at more than three times global GDP.
So how high could rates go from here?
If Rates Go Higher Still
For the past few years, commentators have talked about “high” mortgage and credit card rates. To be fair, these are not high by any historical standard. My own 30-year mortgage, when we bought our home in 1981, carried a rate of 19.2%. But for anyone who entered the workforce or bought a first home after 2005, today’s rates feel high because they are higher than anything in living memory for a lot of borrowers and because they came after so many years of the opposite.
The math backs that up. The average 30-year fixed mortgage rate climbed to 7.20% on September 30, according to Bloomberg, the highest reading in 13 months and up from below 6% as recently as late February. Mark Zandi, chief economist at Moody’s Analytics, has said the market is effectively already there and that rates could easily push past 7%, calling it a fragile moment for bond markets worldwide. Lending experts at NerdWallet and Realtor.com have echoed that view, noting that plenty of borrowers are already seeing quotes north of 7% and that rates seem more likely to drift higher from here than lower. Credit card rates, which were already running well into the high teens and 20s before this cycle even started, are unlikely to fall much, either, since they tend to move with, not against, the broader rate environment.
Mark Hamrick, an economic analyst and founder of The Hamrick Brief, summed up the mood well. Rates, in his words, are “higher for longer and could rise further.” He also pointed to real strain building underneath the headline numbers, noting that many households have not gotten the relief from inflation they were hoping for and have been leaning more heavily on borrowing to cover the gap between rising prices and their own savings.
Rates like these slow home sales, raise the cost of carrying a credit card balance or a car loan, and, if they persist long enough, can tip an already slowing economy toward recession. Brett House, an economics professor at Columbia Business School, has framed the underlying worry this way: Higher long-maturity bond yields reflect real investor concern that inflation is stuck well above the Fed’s target, with little clarity yet from the Fed on how it plans to fix that.
The Flip Side, for Savers
All of that is real, and we do not want to wave it away. But there is another side to this story that gets far less attention: what higher rates mean for people who save rather than borrow.
For roughly 15 to 20 years, there was almost no reward for holding cash. Deposit rates sat near zero. Meanwhile, the stock market seemed to climb without pause, which made cash feel like the wrong place to be. That environment may be changing, and if it is, savers stand to benefit in several concrete ways.
An emergency fund or a house down payment sitting in cash for the next year or two is a good example. In a near-zero-rate world, that money earned next to nothing while it waited. In a higher-for-longer world, the same money can do real work for you without taking on market risk, simply by sitting in the right kind of account.
Cash. If short-term rates stay elevated to keep inflation in check, deposit accounts — including the savings, money market and checking products we offer here at Battle Bank — should continue to offer meaningfully better yields than savers have grown used to over the past two decades. That’s worth paying attention to, especially for money you are not ready to invest but don’t want sitting idle either.
CDs. Certificates of deposit become more attractive relative to where they’ve been. A CD locks in a rate for a set term, which can work in your favor if rates do stay higher for longer since you capture today’s rate rather than hoping it holds. It’s worth comparing current CD offers against a plain savings account before deciding where new cash should sit; the right answer depends on when you expect to need the money.
Retirement. Retirement savings can get a real boost even inside a traditional balanced portfolio split between stocks and fixed income. Higher yields on the bond side of a 60/40 portfolio mean the fixed-income sleeve is doing more work than it has in years, generating real income instead of acting as mere ballast. That does not remove the risk that comes with any investment, and this is general information rather than personalized investment advice. But it’s a meaningful change worth discussing with a financial professional if you have not revisited your retirement mix recently.
Lending. Higher rates can eventually create opportunities on the borrowing side too. If elevated rates cool the housing market and reduce competition among buyers, as some economists expect, that can offset part of the higher financing cost for buyers holding cash reserves and waiting for the right property since a smaller pool of bidders tends to leave more room to negotiate on price. It is not a decision to make lightly, and financing costs still matter enormously, but this is one more piece of the picture worth having in view.
Where We Land
None of this is a prediction dressed up as certainty. Rates could fall faster than expected if the economy weakens sharply, and a steep recession would likely bring rates back down in a hurry, the way it always has in the past. But barring that kind of sharp downturn, or something worse, our view is that inflation and interest rates are more likely than not to stay high, or head higher, over the next decade. That would be a real change from the four decades of decline that came before.
This would mark a genuine turn in a trend that has shaped how banks, borrowers and savers have operated for most of our careers. Paying attention, rather than letting the bond market keep marching along unnoticed, seems like the least any of us can do.
This article reflects the views of Battle Bank and is intended as general information and commentary, not personalized financial, investment, or legal advice.